{{ post.title }}
글 편집
글 편집 (이전 에디터)
{{ post.author.name }}
Posted on
| Version | {{ post.target_version }} | Product |
{{ product.name }}
|
|---|---|---|---|
| Tutorial/Manual | {{ post.manual_title }} | Attached File | {{ post.file.upload_filename }} |
By default, each time that it simulates a model, RecurDyn creates an output file in a new output folder in order to prevent the previous output file from being overwritten.
However, you can clear the Create Output Folder checkbox in the Simulation dialog window to force RecurDyn to create the output files in the same folder as the rdyn file.
In this case, the new files overwrite any existing files that share the same name.
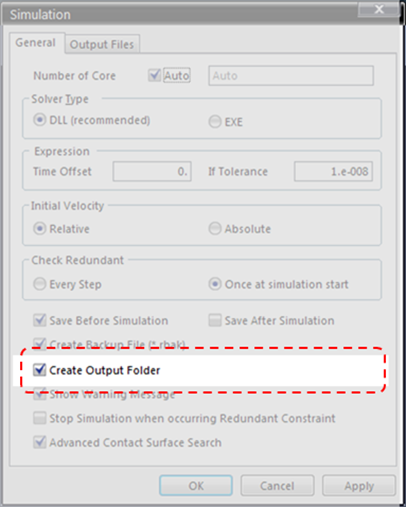
The Create Output Folder option is selected by default.
When selected, you can compare the results of a simulation with the results of a previous simulation by opening the Import dialog window and selecting the relevant rplt file.
To simplify this process, RecurDyn provides an Import last simulated rplt file function in Plot mode.
This function imports the last simulation output file (rplt file).
The following example describes how to use this function:
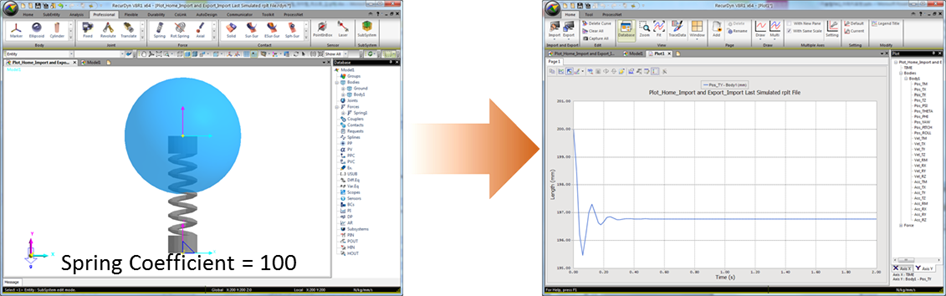
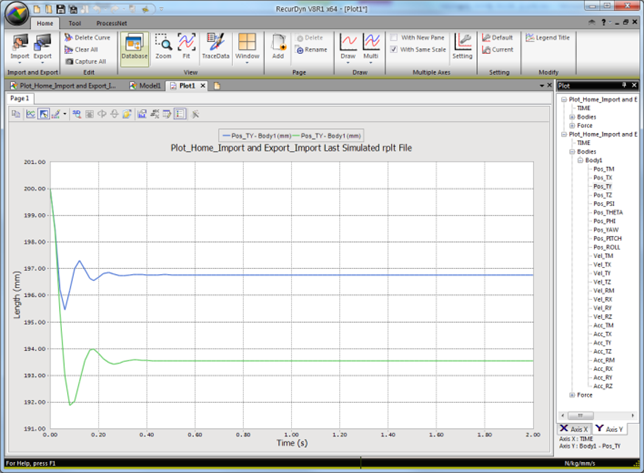
◾ Suppose that you simulate a model in which the spring coefficient is 100 and draw the Pos_TY of Body1.
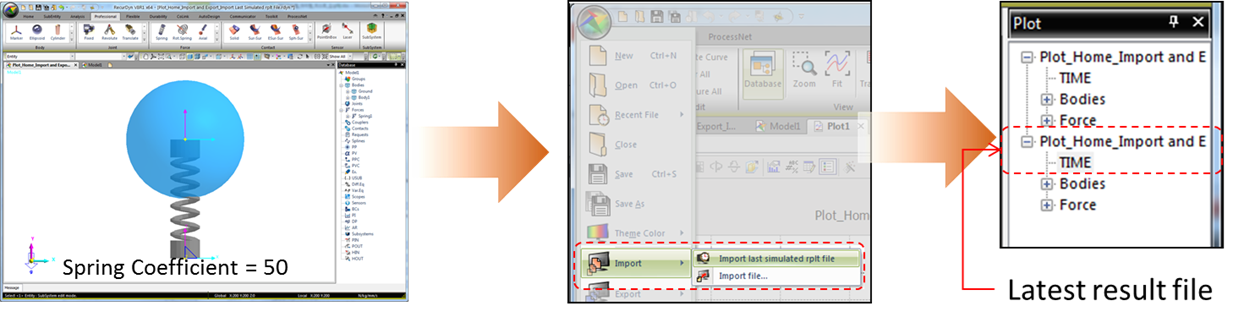
◾ Then, you reset the spring coefficient to 50 and simulate the model again.
You can now open the Plot window (plot document) for the first simulation, click the System Button, select Import, and then click Import last simulated rplt file.
This automatically imports the data from the newest rplt file into the graph.
◾ Now, you can draw graphs using the results of both simulations for comparison.
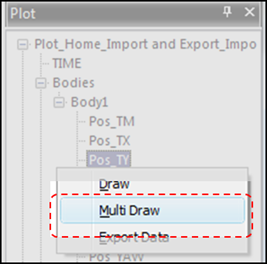
◾ If the imported rplt files have the same data structure, then you can select the same entities from the files and draw graphs with them using the Multi Draw function. (For example, if you import 5 rplt files, RecurDyn draws 5 graphs.)