{{ post.title }}
글 편집
글 편집 (이전 에디터)
{{ post.author.name }}
Posted on
| Version | {{ post.target_version }} | Product |
{{ product.name }}
|
|---|---|---|---|
| Tutorial/Manual | {{ post.manual_title }} | Attached File | {{ post.file.upload_filename }} |
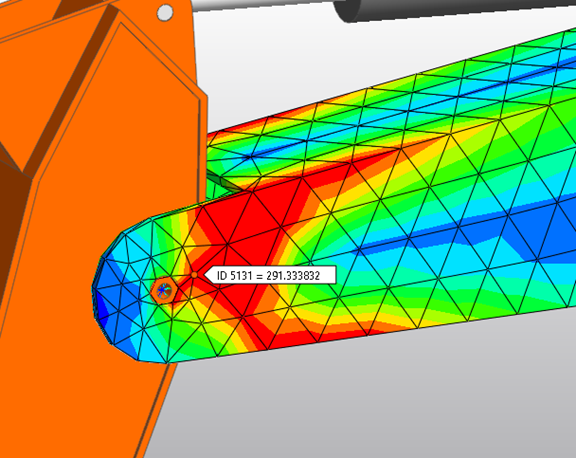
You can display the contour results of specific nodes in the animation of an FFlex or RFlex body after analysis by clicking the Contour Data Trace option in the Contour dialog window.
STEP 1
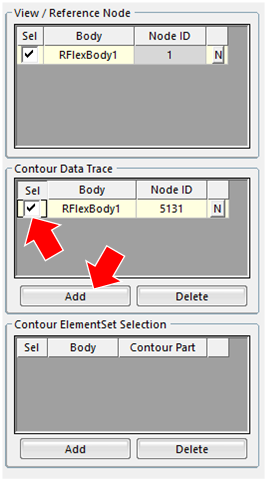
In the Contour Data Trace pane on the right side of the Contour dialog window, click Add. Then, in the Working window, click the desired node.
Select the checkbox in the Sel column to display the added node in the animation.
STEP 2
While the animation is playing, the contour results of the selected node are traced and displayed in real time.
(The contour type, which can be stress, strain, or displacement, determines which results are displayed.)